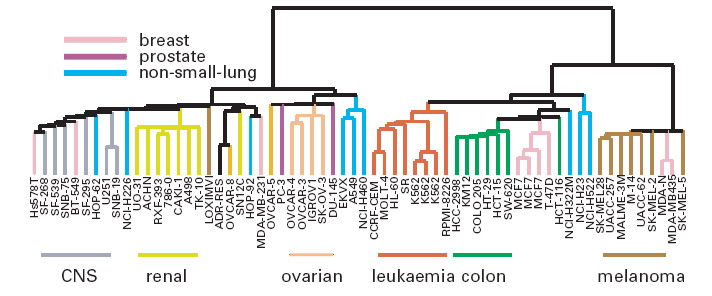
Figure 5.20 NCI60 gene expression dendrogram


发布日期:2006-04-15 来源:- 作者:712 x 296 像素 浏览次数:
274
核心提示:Cell line dendrogram. The tissue type is
color coded as indicated. Note that the two cell lines (K562 and MCF7) tested in triplicate are clustered
very tightly. The dedrogram was formed by comparing gene expression profiles in these cell lines
gro
